BMO Real Estate Forum | Ontario Economic Outlook
-
bookmark
-
print
- Keywords:
- bmo real estate events
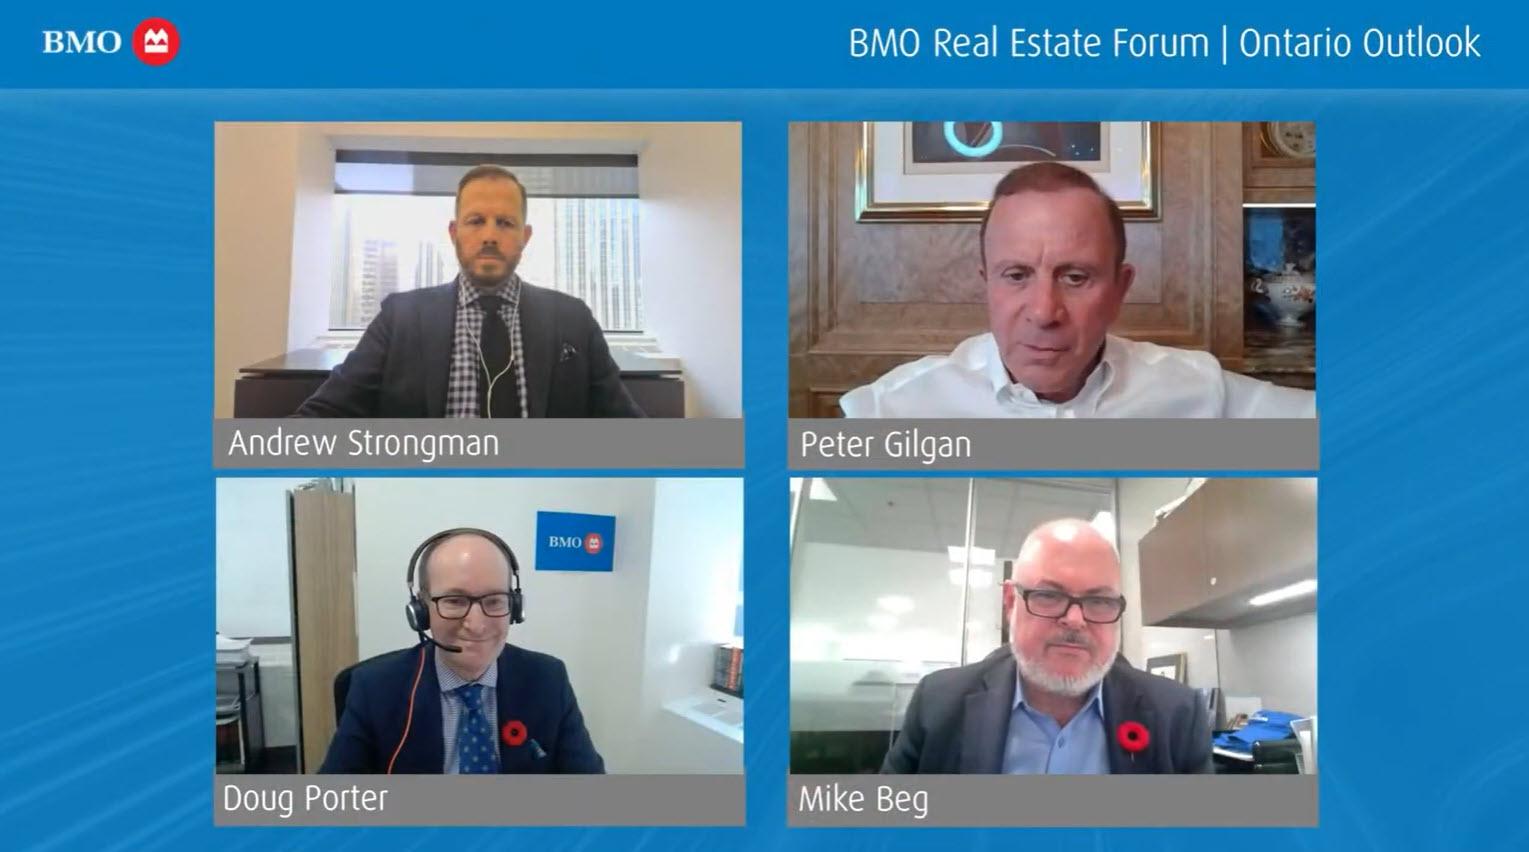
At the 2022 Ontario Outlook virtual event, our industry experts discussed market trends and economic outlook for the Ontario region.
Joining us for the discussion were:
-
Douglas Porter, Chief Economist, BMO Financial Group
-
Peter Gilgan, Chairman & CEO, Mattamy Asset Management Inc.
-
Mike Beg, Senior Vice President and Head, Real Estate Finance, BMO Commercial Bank, Canada
-
Andrew Strongman, Regional Vice President, Real Estate Finance, BMO Commercial Bank, Canada
Mike Beg: Greetings everyone. I'm Mike Beg, head of BMO's Commercial Bank, Canada, Real Estate Finance team. Thank you all for joining us today. For these events we run regionally across Canada, we are excited to be joined by industry leaders who are actively involved in the Canadian housing market and have a perspective on trends and outlook for what's ahead. It's always an informative discussion. We have a lot to cover over the next hour, so I'll walk through the agenda quickly, and then we'll get started.
We'll start with Doug Porter, who will kick us off with an economic update. As chief economist, Doug has over 30 years experience analyzing global economies and financial markets. He's a respected commentator on economic and financial trends and is regularly quoted in the national press and often interviewed on radio and television. Following Doug, we will then have a round table covering key topics and answer questions that were submitted. For that, we'll be joined by Peter Gilgan, chairman and CEO of Mattamy Asset Management, Inc. One of Canada's most successful entrepreneurs and a generous philanthropist to our healthcare system.
Moderating that discussion is BMO's Andrew Strongman. As the greater Toronto area and Southern Ontario regional team leader on my national leadership team, Andrew brings over 25 years experience in finance, progressing through a number of roles within commercial real estate finance. Before we get started, if you are watching the event on a desktop or a laptop, you will see a chat box next to the video screen. Please feel free to use it at any time during the presentation to submit questions to the panelists. Additionally, below the video screen, you will see a link to a survey. We welcome your feedback so we can better shape future events like this one. With that, I'll now turn it over to you, Doug.
Dough Porter: Thank you very much, Mike, and, good afternoon everyone. I just echo Mike's comment thanking you for joining us here today. Basically, over the next 20 minutes or so, I'm going to try to give your a whirlwind tour of the economic outlook to hopefully set the stage for the panel discussion afterward. We got a lot to cover, so let's get right into it.
If we could just turn to the first chart, please, starting with the big picture in terms of how the financial markets have fared in 2022. The vertical line on each one of these charts shows the day that Russia invaded Ukraine. I just want to step back for a moment and just reassert the point that we had a very serious inflation episode on our hands even before the invasion of Ukraine. If we think back to February, at that point, the US already had an 8% inflation rate. Canada already had a 6% inflation rate. Certainly, the invasion made a bad situation worse. As I said, we had a fundamentally tough inflation picture already.
For instance, if we look at some commodity prices, while they did spike in the days after the invasion, most are basically back or below where they were in February. For instance, oil prices, probably the most high-profile commodity, which is on the left there, is actually a little bit lower than it was the day before Russia invaded Ukraine. Yes, as I said, it did make a bad situation worse, but this is not the fundamental factor that's driven inflation higher. Of course, in response, we've had central banks absolutely cranking interest rates this year at a pace that we haven't seen in decades.
I've just picked one interest rate here, the US 1-year government bond yield. I would just remind that, at the start of the year, it was just 1.5%. We find ourselves today at 4%. That is an enormous move in a short period of time. It makes the so-called taper tantrum back in 2013 look like a garden tea party. This is a move in interest rates that, as I said, we haven't seen in decades, really since the early 1980s.
Meanwhile, at the same time, we've had the US dollar just steamrolling against every other currency in the world. The reason why this is important is it's adding to the inflation pressures in the rest of the world. Basically, the US is exporting its inflation to the rest of us. Economies like Europe, Britain, Japan, and Canada are dealing with our own domestic inflation pressures, and then we're getting hit with a double whammy of a weak currency that's lifting the price of all the things we import.
As a result of all these trends and geopolitical issues as well, we've had a very challenging year for financial markets and equity markets in particular. We had a nice bounce in October. In fact, the Dow had one of its best months since 1987 last month. A nice recovery, but it doesn't take away from the bigger picture that equity markets have struggled. When we add up the components of an inverted yield curve and the big run-up in interest rates we've had and the struggles that we've seen in equity markets, it definitely casts a bit of a dark picture for the growth outlook.
Now, if we turn to the next chart, please. Let's just drill down to what we see for the North American economy in 2023. The bottom line is we are in that camp that is looking for at least a shallow recession in '23. I don't think it's locked in stone that we're going to go into an outright downturn next year. Certainly, things could still break in our favor. We could still avoid a downturn, and perhaps the biggest positive would be a meaningful pullback on inflation in the next six months.
At the same time, I also think there's certainly a scenario that's much worse, a potential scenario that's much worse than what I've laid out here. Our core view is that in both Canada and the US, we're probably looking at basically no growth in 2023, and that includes an outright downturn in the first half of the year.
Now, looking back at this year, it's actually going to end up being a pretty strong year for the Canadian economy. It looks as if Canada will have grown by better than 3% this year. Some of that is the reopening play. The fact that tourism, travel, entertainment did bounce back more completely this year. As well, we had a very solid grain crop, it looks like, on the prairies this year that that will help support growth, and we definitely out-distanced the US. The US had really sort of an average year this year because they had their reopening in 2021.
As we look out into 2023, the one big weight that Canada has is the share of the housing sector, and the Canadian economy is about double that of the US. When you think of renovation activity, real estate fees, and new home building, that's worth a little bit more than 7% of the Canadian economy, whereas it's only worth about 3.5% of the US GDP. When housing is going into reverse or struggling, that's a much bigger drag on the Canadian economy than it is on the US economy, and that's why we basically see Canada's growth advantage waning to nothing in the year ahead.
If we turn to the next chart, please. Just drilling down more specifically on the consumer, I think this cycle might look a little bit different than other cycles. I think one reason why the consumer might still hang in there relatively well over the next year is because of the story that many, including us, have been pounding home for the last year or so that Canadians did build up a great stock of savings during the pandemic.
There's different measures of this. A generous measure of it would suggest that they saved more than $300 billion above and beyond what they normally would have saved in the last couple of years. That is a huge amount of money. That's worth almost 20% of a year's worth of disposable income. That's a huge amount of potential savings. That might be a little bit exaggerated, but even if you look at a very simple measure, just the amount of extra personal deposits we see on bank balance sheets, they're running about $130 or $140 billion above and beyond what they normally would've grown to at this point, and even that's roughly 10% of disposable income.
Any way you look at it, there is this great deal of pandemic savings that are still out there. By the way, that's the case in the US as well. That's the good news. The less good news is household debt. Really has never gone away as an issue. We did see it dip a little bit in the early months of the pandemic. People did pay down their credit card debt originally, but then the boom in the housing sector began to drive up mortgage debt in the last year or so. We now sit in a situation where the average household has about $1.80 of debt for every dollar of income.
Now, I would stress that that is an average number. Averages hide as much as they tell you. The reality is only about 40% of the population is really responsible for all that debt. I often get asked the question, how can we have record savings and all these excess savings on the one side and record levels of debt on the other side? The simple answer is it's two different groups of people. Basically, those savings are heavily concentrated among upper-middle-income and upper-income folks. The debt is, of course, basically concentrated the 40% of Canadians, or roughly 40%, who are homeowners who also have mortgages.
The way I think this sorts out is I think the consumer will hold up a little bit better than they normally would in the face of an economic downturn, but the rapid rise in interest rates will slowly but surely squeeze those 40% that are mortgage holders. I don't think it happens right away. I think this is something that will slowly but surely seep into the economy in the years ahead, slowly but surely weighing on consumer spending as we look ahead.
Now, turn to the next chart, there is one other big positive out there for the consumer outlook, and I would assert for the underlying housing outlook too. That's the job market. We are looking at one of the strongest job markets, one of the healthiest job markets that we have seen in generations. It goes above and beyond just the unemployment rate, which is basically bouncing along at the lowest levels that we've seen in decades.
By the way, that's not just the story here in North America. That's really a story almost around the industrialized world. In almost every major economy, jobless rates are now lower than they were before the pandemic began, and those are some of the lowest jobless rates that we've seen since the late '60s or early 1970s, but as I said, it goes above and beyond that.
On top of that, we've also got a lot of vacant jobs. In Canada, we've almost got a million jobs that are open right now. The US just reported this morning that they still have almost 11 million open jobs. That's almost two open jobs for every unemployed person in the US. It's not quite as extreme in Canada, it's about one for one. There's about one open job for every unemployed person in Canada, but to me, that is the very definition of full employment.
Essentially, the Bank of Canada would never come out and say this, but they actually want to see that labor market slack in a little bit. Again, they would never say this, but they would actually like to see the unemployment rate nudge up a little bit here to take a bit of steam out of the labor market. If we turn to the next chart, their concern is that the run-up that we've seen in prices in the past year and that tight job market are going to point to a lot of wage pressure, and we're already starting to see it.
In the US, wages are running at about a 6% to 7% rate. In Canada, they were a little bit slower to get going, but now they're rising by about 4% to 5%, depending on which measure you look at. Those are strong numbers, no doubt about it, but they're actually trailing well behind inflation.
On the one side, we've got one of the tightest job markets that we've seen in generations, and on the other side, we've got wages that are actually trailing behind inflation. To me, that's the very recipe for a lot of labor market tension in the year ahead. We're already certain to see it. Whether it's in the public sector, we almost had a national rail strike in the US. I do think we've got a lot of wage pressure coming at us in the next year or so.
If we turn to the next chart, and ultimately, this is the nub of the issue. This has been the economic story in 2020, and that's the big run-up and inflation that we've seen globally. Again, this is not a North American story as you can see from that chart on the right-hand side. We've got over 10% inflation in Europe and Britain. Canada's actually at the lower end of G7. We're not the lowest. Japan is a bit lower than we are, but even for Japan, a 3% unemployment rate is high. They had no inflation in the last 30 years.
The only economy that's got "normal inflation" by their own standards is China. That's why China is running against the grain and actually trimming interest rate while everybody else has been cranking them higher this year.
Looking ahead, we do think inflation will moderate a little bit over the next year, but we've tended to be of the view, and we have been for about 18 months, that this inflation episode is a little bit more real than many people appreciate, that it's going to prove to be stickier. It's going to be tougher to get out of the system than I think many believe. Our view is that inflation is still going to average close to 5% in 2023 in both Canada and the US. It will be coming down during the year, but our view is unless we get a dramatic break in energy and food prices, we're probably looking at overall inflation of close to 5% in 2023.
If we turn to the next chart, just very briefly, what's caused inflation to get to this level? What's the issue? How did we go from years and years of less than 2% inflation to suddenly 7% inflation overnight? If you look at the right-hand side of this table, those are the things that have increased the most in price over the past year. This is the percent change in a variety of goods and services in Canada, their prices over the past year.
To me, there are five different stories, five different themes here that have driven inflation from 2% to 7% almost overnight. Very, very briefly, those five things are energy prices, so natural gas and gasoline prices. The reopening. Last year, nobody was traveling; this year, everybody was traveling. Motel rates and airfares have bounced from very low levels. Third story is a supply chain issues that we've all heard so much about. For years and years, furniture and appliance prices, big-ticket items, consumer items went nowhere in price. Suddenly, everybody wanted a dishwasher all at once, and that stressed the global supply chain.
Now, the supply chain is improving, but we still had a double-digit increase in things like furniture and appliance prices, and vehicle prices are still strong.
Fourth story is the global food crisis. This is not a Canadian story. I know the competition bureau is looking at our groceries right now, but take it from me, grocery prices are up by double digits everywhere. In the US, they're actually up by 13% in the past year. Our grocery prices have actually gone up less than in the US. There's no single factor that's serving grocery prices up. By far and away, the biggest has been bakery products, cereals-- basically, anything related to grains has gone up the most, but every aisle in the grocery store has seen big increases in the past year. Again, this is a global story, not a Canadian story.
The fifth driver here has been the housing boom in the last couple of years. Now, housing enters the Canadian price basket in a very unusual way. It comes in through real estate agent fees, through new home prices, through rent. It doesn't enter directly through existing home prices, but it does get into the CPI eventually. It has played a role in driving up inflation. That's five different things.
The thing I want to leave you with there is there's no one thing that's going to turn inflation off. There isn't just a light switch that policymakers can turn off to make inflation go away. That's five different themes that have to stop going wrong or maybe even start going right over the next year to help bring down inflation. Now, for the record, we do think a few of these, at least, will improve or topple. We think energy prices will stabilize. We think the supply chain issue will improve. I don't think we're going to get the reopening bounce again next year and things like airfares and motel rates, but still, the underlying pressure will still be there, especially I think on things like food prices.
Now, if we turn to the next chart. One area where we are going to get some relief, at least in the consumer price basket, is on the housing front. It's tough to describe just how quickly the market has changed there. If we look at the left-hand side, that's the level of existing home sales going back to the year 2000. This is on a seasonally adjusted basis, month by month. You can see how basically sales stalled out, of course, in the opening months of the pandemic. They came roaring back and then they stayed at that level that we've never seen before for almost two years. Then around March, they began to fall, and they have fallen hard. Now, they're below the long-run average.
Usually, it takes about four to six months for a big change in sales to translate into prices. It seems to have happened a little bit faster this time. If we look at the right-hand side, you can see that national prices, at least based on CREA's MLS indicator, which takes quality adjustments into account, prices are now down nationally by about 9% from their peak, and that shows you city by city how much prices are down since February. Now, you'll note the cities that have declined the most at the bottom, Toronto, Oakville, London, Hamilton. What do all those cities have in common? They're all in Ontario. Ontario had the biggest boom during the pandemic. Now, we think it's going to have the biggest correction.
If we turn to the next chart, we can get a better sense of just the regional dynamics at play. The two-line charts on the left show you. We look at a long-term trend in real home prices. It gives you a sense of how far away home prices got from that underlying trend. Basically, we were rivaling what happened in the late 1980s in terms of how far above we got above that long-term trend in real home prices that at the peak earlier this year, now they've come off a lot since that point. They're still above the long-run trend.
The little table on the right gives you a sense by region just how far away we got by region. It gives you a sense of how different it is by region. Ontario was by far and away the furthest above and beyond. Its underlying price more than 50% above. It wasn't really a GTA story. GTA, yes, was strong, but it wasn't as strong as some of the smaller cities outside of the GTA and cottage country as well.
Meanwhile, looking at the rest of the country, you can see that places like Quebec and Atlantic Canada would be next in line. BC actually didn't get that far above its trend, and most of the prairies are actually below their long-run trends. We don't think they're really going to see much of a correction at all. This is very much so an Ontario story.
I know that conventional wisdom among Bay Street economists, and that would include ourselves, is that national home prices are going to decline by about 20% to 25% from the peak. We happen to be in alignment with that view, but I would just stress that we're probably looking at pretty extreme regional differences on that front. I do think Ontario is going to see a bigger decline than that whereas a place like the prairies might really see not much of a pullback at all.
If we turn to the next chart, please, just as a very quick overview, we took a look at a number of different housing market corrections that we've been through in this country. We identified seven pretty meaningful corrections that we've been through over the years. looking back over the last 35 years or so. I think the main point here is there's no cookie-cutter pattern here for corrections. They can be of different depths, they can be of different lengths certainly over the years.
If you look at the average of the seven, it's a bit instructive, the average decline has been about 15% and the downturn has lasted about three years. The three-year total does ring about true to me, that does sound about right. I suspect that the downturn in national prices could be a bit more than that normal 15% just because the build-up to this point was so great.
Now, if we turn to the next chart, please. Ultimately, how far we go, how big of a decline we have will come down to, ultimately, how far does the Bank of Canada have to go. Now, of course, we just heard from the Bank of Canada last week, they mildly surprised the market by "only hiking by half a percentage point." The market had been expecting three-quarters of a percentage point. Some called it a blank. I would just stress the point that a 50 basis point move is still very large. No central bank in the last 20 years-- no major central bank had hiked 50 basis points until this year. Now it's almost become de rigueur if not a three-quarter point, hike.
The reality is the Bank of Canada has still been the most aggressive central bank out there. They have hiked rates by three and a half percentage points since the start of the year. Their overnight policy rate of 3.75 is the highest among all major central banks. The Fed is about to leapfrog them. We believe the Fed will hike rates by three-quarters of percentage points tomorrow.
Looking ahead, our view is that the bank is getting close to the end, we're officially calling for two more quarter-point hikes at each one of the next meetings, and then we think they do pause to reassess. It's entirely possible that they pause at 4% and don't go that extra quarter. It's also possible that they go a wee bit more than that. We happen to believe that 4.25 is about the right level for them to take stock and to stop.
We think the Fed is going to do a bit more. The reason why we think the Fed will do a bit more is inflation pressures are a bit more intense in the US than Canada, and we also think that the Canadian consumers are a bit more vulnerable to the rate hikes that we've seen. Thus, the Bank of Canada is likely to pull back and pause before the Fed does.
The risk to our call on rates is if we're going to be wrong, we think that they might have to do a little bit more, and we don't see that necessarily over the near term. We would see that more as an issue in the spring of next year when they decide that perhaps they haven't done enough. That's the point at which I think we might be wrong, that the Fed and the Bank of Canada might have to keep raising rates even in next year.
I know there's a big body of opinion out there who believes that rates are going to start getting cut in the second half of next year. We're not in alignment with that. We think that rate cuts are more of a story for 2024 and 2025. That's the point at which we think that inflation will have oriented enough for the Bank of Canada to start backing off.
We do think longer-term interest rates may begin to move lower through the back half of 2023 as the market looks ahead to the possibility for rate cuts in 2024. At this point, our view is that rates are likely to remain basically stable through 2023 and until the central banks are convinced that inflation is-- they've gotten it under control and it's back to more acceptable levels.
If we turn to the next chart, please. Just the last topic I'll touch on before wrapping up is you might be wondering, well, if the Fed is going to raise interest rates by more than the Bank of Canada, doesn't that spell a lot of downward pressure on the Canadian dollar? The short answer is, yes, it does, but I would argue that's already happened. That's the reason why the Canadian dollar has weakened so much in the last couple of months, is because the market came around to this view that the Fed is going to raise interest rates more than the Bank of Canada It got built into current market pricing, and that's what drove the Canadian dollar down more recently.
As we look into 2023, our core view is that the US dollar itself is likely to lose a little bit of altitude next year. As I said at the opening, it's been like a steamroller against every other currency out there. We see it losing a little bit of steam in 2023, and that's the single biggest driver for the Canadian dollar, is the US dollar itself. As the US dollar loses a little bit of altitude, we see the Canadian dollar making a bit of comeback next year.
Final chart, I'll just wrap up before I hand it over, is, as I said, when we look ahead, whether we do go into recession, how far the Bank of Canada and Fed have to raise rates, it does come down to the inflation. Look, this is our official view on where Canadian/US inflation is going to go over the next year and a half. We still see it above 7% or at 7% by the end of this year. We then see it coming down pretty abruptly during the spring. By the end of next year, we've got it at 3.5% in both Canada and the US. That's a good improvement from where we are today, but it's still too hot for comfort for the bank and the Federal Reserve.
Ultimately, that's why we don't see interest rate cuts until 2024. That inflation rate at the end of next year is just still a little bit too hot for comfort. That's why we see basically the Fed and the Bank of Canada maintaining those rates through next year before they finally relent when we get out into 2024.
That's it for the formal part of the presentation. I am now going to pass the baton over to Andrew who will run the panel discussion. I thank you very much. Bye now.
Andrew Strongman: Thank you, Doug, for your insights and update. We'll now move into the round table portion of the event, and thank you to those that submitted questions during the registration. We will address as many as possible. Let's get started. Housing affordability continues to be a contentious topic and a major concern in the Ontario market. A recent CMHC report indicates Ontario needs 1.85 million homes to achieve affordability by 2030. 200,000 people are expected to migrate to Ontario in 2022, and demand seems to be growing versus contracting, which does not bode well for affordability.
Earlier this year, there was an Ontario Task Force report with recommendations to address affordability in housing supply. Peter, what do you think the various levels of government at the federal, provincial, municipal level can do to alleviate the supply issues? What is the role of the builder in the developer industry to help? Affordability and supply seem broken, even with the healthy price correction outlook. How does this get fixed?
Peter Gilgan: Let's talk about all three levels of government differently because they all play different roles. The components of cost include land, labor, materials, and an absence of excessive taxation. I'd say those are pretty much the four components. On the federal, there's a few things I think we could think about. Obviously, land supply is primarily a provincial responsibility and falls under their jurisdiction. However, even at the federal level, there is a significant amount of federal land that's deemed to be surplus that's laying there.
I think that if the federal government were to get really serious about affordable housing, the difference between affordability generally and providing affordable housing for those that are least able to afford any kind of accommodation. I'm talking about that sector of the market and the economy.
If we were to look at a lot of the surplus federal land that's around and made a concentrated effort and put a real task force onto it and said, "How can we convert some of this land into the fabric under which we can build really below market price housing for those that can least afford it?" The trick would be to not make a study out of it and have somebody make a career out of making a study about it, to actually put a task force in place to actually get something done. That could address a certain element of the market that's really underserved today.
The other thing the federal government could do really in terms of the labor side, there's a huge shortage of qualified labor. It drives not only inflation and labor costs but a reduction in productivity, which, of course, contributes to increase in cost over time. Our immigration policy right now gives no real credit to skilled trade. My recommendation would be to encourage and support with our point system the invitation to have skilled trades, people from around the world come into this country.
That's what built our country over the last 150 years, was really skilled immigrants that came to the country, and for a generation or two, stayed in the construction trades. Then, of course, you got to go to university to become whatever once you get out of my business. That's all gone away because we haven't been bringing those folks into the country.
Lastly, on the taxation side. A huge part of new home prices is something called HST, and a good component of HST is GST, which replaced the old FST. When that was introduced some 30 years or so ago at a rate of 7% was to replace it, and it was a 7% across-the-board as opposed to a 9% tax on the wholesale price of materials. The wholesale price of materials, if we looked at today, would represent about 1.3% of the price of the house. The actual GST portion of the HST is about 7%. There's a huge element of federal taxation baked into the price of every new house.
There used to be a rebate for houses under a certain price. That rebate remains-- In fact, it's still there today, but it's irrelevant because it was never indexed to the price of housing. It's become a completely inoperable thing. That's the federal side.
On the provincial side, I'm really pleased to see the introduction in Ontario of this Home Built Faster Act frankly that adopts or proposes to adopt a lot of the recommendations in that task force that you referred to, Andrew, and that was issued in February. There's about 55 recommendations in that task force. I would say I wholeheartedly agree with about 54 of them. They were really well thought out. The chair of whom was a senior banker. Not folks from the industry, all that. Not a self-serving group of people in one suspect or whatever. It was not done by our crowd. It was done with the interest of society at large. That's things like three units in a single family's owning, et cetera.
The really significant thing that's addressed there is this thing called development charges. I want to talk a little bit about that. It's mandated by the province and operated by the lower tier of municipalities and development charges have increased in some cases in the last 20 years by upwards of 500 to 1,000%. You heard that right. What's happening a lot of times with development charges--
The double irony is this. Operating a municipality, there's a lot of generalized costs that go to replacement of roads, replacement of old bursted water lines and busted up-sidewalks and things like that. When a new community's built, all those services are new, so there's no cost to repair those services in those new communities for 40 or 50, or 60 years depending. In fact, those communities, whoever, are subject to the same general level of taxation, even though they need less services.
In fact, what they do is support the existing housing stock in keeping property taxes low. What's also happening to the new housing sector, and therefore, to new home buyers, future taxpayers, if you want to look at it that way, is that a lot of the development charges that are being levied, it's been found by many studies. One, for example, C.D. Howe a couple years ago, there was over $6 billion of money collected for new water infrastructure, but in fact, only 60% of it went to new infrastructure. About 40% went to support existing operations of existing plants.
Clearly, outside the intent of the Development Charges Act, but it's become a standard way that municipalities have managed to keep property taxes at very low levels, even levels below the rates of inflation. Even though we see the actual cost is higher, they're supplementing the revenue needed by taking it from development fees, which, in fact, for is taken from the new home buyer.
That's really something that I think the province has to put their foot down hard. I say on the municipal side, I want to talk about attitude a bit. There used to be a service attitude at the municipal level, that recognizing that if they support the home building industry, they're actually supporting citizenry to get into a house that they can afford. That somehow has gone away. The developer guy is really seen as the ultimate enemy of society by many. Anything you can do to obfuscate, to delay making decisions.
20, 25 years ago when this whole crisis started, frankly, with some legislation, and it-- I don't want to talk a conspiracy theory or anything, but it was just this whole attitude thing where let's slow things down, slowing down, no houses. Less houses is better. This whole socialistic approach and everything that crept into our society here in Ontario, most explicitly to be blunt. I started to see it--
It was funny. It evidenced itself almost 20 years ago, 17 or 18 years ago. We've started to have to close our sales offices. Not because we didn't have land, but because we, all of a sudden, couldn't get our land through the system on the same timeline that we had previously. We had to reduce our ability to produce houses back then by 30 or 40% from what we had been doing, at least 30 or 40%.
Again, not because we didn't have the land, but because we couldn't get it approved. We need to see that trend reversed. We need to see municipal leaders say to their staff, "Let's stop this delay. Let's find ways to streamline the processes. It's not at the expense of the environment, at the expense of society, but let's try and find ways to put things on more of a war footing. Let's declare housing affordability as the enemy, and let's go to battle against that collectively," and I think we could make a big difference.
That's what government can do. I think what our industry could do is we have to really promote ourselves, not for ourselves, but as advocates for the home buyer. It's an attitude thing with us as well.
Andrew Strongman: Well, I appreciate that. Great answer, Peter, and some great insights on a very important challenge that we face with housing affordability. I'm going to shift over to some interest rate questions. Doug, when do you expect this interest rate-driven housing correction to bottom noting our builders are adjusting their product to bring prices down and emerge from the correction? As an economist, what do you think we need to do to drive affordable stable housing prices and market equilibrium going forward?
Doug Porter: Well, I'll start with the easy part, and that's on the interest rate look, well, in so far as that part's easy. I think the message from the governor think, and the governor last week was fairly clear. First of all, the fact that they actually did slightly surprise the market by going less than what was priced in. I think by itself was a bit of a statement that the bank thinks it's getting closer to the end of the interest rate hikes. They were also careful to point out that they still believe that interest rates may have to go a little bit higher, but I think the body language is that they believe they're getting close to the amount that they have to raise interest rates by.
As I said, our official call is for another pair of quarter-point hikes at each one of the next two meetings which would take the short-term rate by a half. Again, I would just stress how overwhelming this interest rate tickle has been in such a short period of time. That extra half a point would bring the total cumulative of hiking since the start of this year to 400 basis points, four percentage points. We have rarely seen that a move in the space of a year.
Of course, it's been driven by the fact that central banks around the world really did misjudge the inflation issue that we were dealing with, the severity of it. We believe that four-point hike is enough to cap inflation. It's going to take a little bit of time. I think we're going to have to be a bit patient. The old rule of thumb is it takes 12 to 18 months for an interest rate hike to fully work it's way through the economy, and then it can take even a little bit longer to weigh and to fully work its way through to inflation.
I think things are happening a little bit faster in this cycle. It might not take quite that long, but I think the central banks have to be patient. They have to be careful not to overdo it. That's going to be a challenge in the next three to six months because we're going to go through a period where they think they've done enough, and it could be a little bit of time before inflation actually starts to show the improvement from the rate hikes we've done. That's going to be a period of anxiety for the central banks when they're worried whether they've done enough or not.
The art of central banking is more of an art than a science. There are a lot of gray areas here, and they have to be careful both not to over tighten, not to race interest rates too far and overdo it, but they've also got to be careful that they don't underdo it and we end up in the worst possible situation a year from now where we find we've still got high inflation and we've been dealing with the weak economy. The short answer to your question is I don't believe rates have to go up a whole lot further from here because they've already gone up dramatically.
In terms of how long this will play out for the housing market, I personally believe that the interest rate hikes we've seen to date have not fully been absorbed by the market. I think there's still a little bit of price discovery going on. We've seen listings come back down in recent months as a lot of potential sellers have pulled their units from the market, perhaps waiting for a stronger market. I think we're going to be in a bit of a standoff here for a while.
I personally think there is another leg down. As I said, we're in the consensus that looks for about a 20% to 25% decline nationally in home prices. To date, we've seen about a 9% to 10% decline. We think there is still a bit further of an adjustment to go.
In terms of affordability, so full disclosure here. We've definitely been of the view that there are two blades to the scissors here in terms of affordability. There's a supply issue, which Peter laid out extremely well in his very good answer there. We would assert, there's also been a demand blade to this. We just went through a period where we had extraordinarily low-interest rates for a couple of years, way below inflation. The central banks around the world were doing everything they could to stimulate things.
What part of the economy is most volatile or susceptible to interest rate changes, of course, the housing sector. When you keep interest rates at extraordinarily low levels for a number of years, of course, you're going to have an overshoot on the one side, on the demand side in the housing sector. That's exactly what we've seen in the last couple of years. All I would say is let's just see where the market settles out after the Bank of Canada is done raising interest rates.
Let's come back in a year or so and reassess in terms of supply-demand imbalance that we face at this time. All we'll say is there are all kinds of different indicators that have suggested that investment in real estate, the investor class has absolutely grown by leaps and bounds in the last couple of years. Let's see what happens to that group of investors given the big backup in interest rates that we've seen in the past year.
Andrew Strongman: Thanks, Doug. That's a great answer. As much or more so than the rest of Canada, Ontario continues to face rising construction and land costs. Materials and labor, inflation, skill-building trade labor shortages, and generally restricted municipal policies, as Peter outlined. Peter, how are the builders and developers like Mattamy responding to these challenges and constraints that impact the project economics? Frankly, any advice for builders from your decades in the trenches?
Peter Gilgan: There's a couple of parts to that question. What can the industry do about it? I started to touch on that. I think we really have to be better at communicating to all levels of government and bureaucrats that we often present ourselves as speaking for a self-serving manner. We're really at underneath that. We're really representing new home buyers and we're a flow-through. Whatever costs or restrictions are imposed on us as an industry, as long as it's even-handed across the industry, it comes through as an increase or decrease in the cost of delivering that housing unit to the end consumer.
We have to do a better job of helping folks understand that we're trying to serve a segment of society, provide good, affordable housing to them. I don't think we've done as good a job with that in the past as we might have. I see some of the folks that speak for us now, some of the industry association leaders are starting to do a much better job with that, and I'm pleased about that. Many of the things I outlined before that could reduce the actual cost.
Right now, I can tell you that based on the cost structure that we look at, there's not a huge amount of room, there's not a huge amount of excess profit to give up. Finding ways to push costs down in order to maintain a viable-- If you don't have a viable business, nobody's going to build anything. Then we got another problem. People just take their miles and go home. Today, Mattamy, my company, we build more houses in the US than we do in Canada. We can build for about half the price in the US that we can in Canada. About half the price, I can give you the same house in the US and make a better return.
There's stuff in our structure here, the cost structure, the labor structure, the taxation structure, and most importantly, the processing time structure and the availability of land structure that makes things much less affordable. We have to continue to communicate that, advocate that to government, and hopefully, over time, move things more in the direction of the home buyer.
Andrew Strongman: Great. Thanks for that, Peter. Doug, looking at these Ontario national challenges and things like the builders access to skilled trades, what is the supply chain outlook for this industry, and what, in your view, could the government or industry do better to address input and labor costs and supply?
Doug Porter: I actually think Peter hit on a lot of the key points there. For instance, we just had the federal government announced their new immigration targets for the next couple of years, and they've actually been ramped up a little bit further, yet ultimately rising to 500,000. It's interesting. This comes at a time when Quebec is actually talking about streamlining, or even reducing its goal in terms of immigration. I suspect that while, increasingly, immigration has fanned out across the country, Ontario's probably going to get more than its share of the population in the next few years. I think there is going to be quite strong population growth in Ontario in the next few years.
The interesting point will be how does that sort out between helping to actually alleviate some of the skilled labor shortages, or even unskilled labor shortages that we face at this time, and at the same time, we're seeing more pressure on the demand side for housing.
I actually am a bit concerned that the way it's going to sort out is we actually end up with more of the latter and less of the former. If there's any good news, though, and I appreciate that this is a bit of a smaller part of the puzzle, in recent months, we've actually seen quite a bit of an improvement in the global supply chain. A lot of the leading indicators are pointing to less pressure in terms of the materials prices. Things like lumber prices and a variety of construction materials, at least the wholesale prices, have been coming off in recent months.
Some of this is because financial markets are looking forward to much slower growth, globally. At least on the good side, we're seeing a little bit less pressure.
I think, unfortunately, on the other side of the equation, we are likely to have a bit more wage pressure over the next year or so. I touched on it earlier, how, if anything, even though wages have been rising, they've been rising by less than inflation for the large part. We've still got a very tight labor market, we've still got a lot of empty jobs, open jobs, and we've got a lot of workers who are going to be wanting to play catch-up to the inflation we've seen.
I think we've got a better news story in terms of materials prices over the next year. I think we've got a tougher challenge on the wage side. The way I think that sorts out is I don't think the cost pressures as a whole are really going away, at least from the building side.
Andrew Strongman: Great. Thanks, Doug.
Doug Porter: I think Peter's going to comment there.
Peter Gilgan: To pile on to what Doug said, I completely agree with him that wages have no place to go but up. Wages certainly have to keep pace and outpace the rate of inflation, and nobody would want to see anything other than that, but there's a cost of labor and then there's a productivity of labor issue. It's the skilled tradesmen that will produce three times as much in a day as the unskilled worker. I've seen it many, many times. Just a simple example, when I first got in this business 40 years ago, a skilled crew of carpenters would put up a house in a week. Now, a semi-skilled crew takes six weeks to build the same, or even a lesser house.
That's a question of, how productive are you when you're not skilled? Not only does that increase the overall cost on a pure P&L basis, but it also procrastinates the ability to deliver that house. The longer you carry that house, the more investment you have for the longer time adds to the cost pressure of the house altogether. There's two components that contribute to those delays, are the cycle time, being able to turn dirt into cash, as I call it. When it doubles or triples, it massively impacts the overall price of the end product in a negative way.
Andrew Strongman: Thanks, Peter. Some great points there. I wanted to turn our attention to a couple of questions on ESG and sustainable finance. New construction or major renovations can create opportunities to achieve higher ESG standards to reduce CO2 emissions and energy efficiency and cost savings. Buildings account for approximately 30% of total greenhouse gas emissions in Canada, which includes both operational emissions and embodied carbon. Peter, what do you and Mattamy see as the challenges and opportunities in the current market environment for builders like you to support ESG and energy efficiency?
Peter Gilgan: First of all, I want to tell you that my new title at the company is chief sustainability officer, so I have a very strong vested interest in seeing us succeed at this. We're investing a huge amount of time and effort into the E part particularly, not at the expense of S and G, but on the environmental side, the sustainable development side. We're running workshops all across our entire business. In fact, I'm off to one tonight and tomorrow here in Canada and then next week in two of our offices in the US where we've put in huge programs in our company where we're starting to measure the embodied carbon in everything we build and the emissions of the built form.
We're actually introducing in the next several months-- I'm working with the Canadian Institute of Charter Accountants, or now they're called the CPAs, whatever the new title is. We're working with them to develop a parallel accounting system where we account for our carbon, both in terms of carbon tonnage and also in terms of the dollar equivalency to that carbon tonnage with a view toward measuring our results in total economic system, including the impact of carbon with a view toward continuing to drive that down. We've formed a coalition with others in the building sector in the non-residential building sector.
There's a lot that can be done. We see a lot of low-hanging fruit. There's a lot of data available now. There's a lot of technology available now. The time to act is absolutely now. This decade, we've got to go at it very hard. Stop talking about it, and get really real about it. We're going to do that here at my company, at Mattamy.
One of the things that we're going to do and we're committed to do both in our business and in our coalition partners is be completely transparent, share everything we find with all of our fellows in the industry. This is not about gaining a competitive advantage for Mattamy or anybody else. There's a common enemy here called CO2 emissions, global warming, greenhouse, gas, whatever label you want to put on it. We're going to do everything we can to be a leader, to be the leader for the residential sector and our coalition, to be the leader in the entire built-form sector, to turn Canada within this decade into one of the global leaders in reducing greenhouse gases in our sector.
Andrew Strongman: Well, that's great to hear, Peter. I think a lot of good activities are happening there and we appreciate that. Mike, what do you think institutions such as banks can do to support the energy efficiency cost?
Mike Beg: Thanks, Andrew, and I'll try and keep it brief because I know you're close to wrapping up. Banks have to walk the talk with their own premises, whether owned or leased. I think we need to be seen as doing our best to reduce our physical and carbon footprint as much as possible and supporting our clients in that same goal. ESG is a key component of BMO's purpose statement that aims at growing the good in business and in life. ESG also relates to housing affordability too, as inefficient buildings burn more energy and costs more to homeowners and renters.
Andrew Strongman: Maybe just with the last minute or two, I'll ask one final question. Peter, what property classes will likely, in your opinion, offer the best possible returns in 2023 and beyond, and is Mattamy shifting its strategy at all in face of inflation and rate headwinds to housing markets?
Peter Gilgan: Well, of course, you know what my answer's going to be. [laughs] Look, I'm not qualified to really speak. I'm surprised by how well industrial land prices are holding up. For example, I know a little bit about retail. I have had retail over the years. It's changed so much and continues to change so much that I wouldn't pretend to be knowledgeable enough to comment.
What I will say about the residential sector, we actually just very recently, in the last week or so, released a couple of substantial projects to an investor group. While what Doug said makes absolute sense on the one hand, this investor group I guess has a longer-term view. They and we priced the units in recognition of as what Doug said, that sort of 20%, 25% pullback from the march 2022 peak. The investor group ate the product up, loved it, loved the offering, loved the idea that they could still make a return because rent rates are as high as they are.
Doug Porter: Interesting.
Andrew Strongman: That's great. I really appreciate everybody's input to today's questions. Just as a wrap-up, thank you everybody for joining us today. We hope that you enjoyed today's session. I want to thank you again for taking the time out of your busy day to spend time with us here. On half of BMO, we want you to know that we're thinking of you, your families, and your organizations. We're here to help. We've been through uncertain times over our more than 200-year history. We have a strong capital position, and we're well prepared to serve our clients. Thank you and have a great day.
Mike Beg
Head, Real Estate Finance
Mike Beg as Head, Real Estate Finance, Canada is responsible for management of BMO’s Commercial Real Estate Finance group and its client relationships across …(..)
View Full Profile >At the 2022 Ontario Outlook virtual event, our industry experts discussed market trends and economic outlook for the Ontario region.
Joining us for the discussion were:
-
Douglas Porter, Chief Economist, BMO Financial Group
-
Peter Gilgan, Chairman & CEO, Mattamy Asset Management Inc.
-
Mike Beg, Senior Vice President and Head, Real Estate Finance, BMO Commercial Bank, Canada
-
Andrew Strongman, Regional Vice President, Real Estate Finance, BMO Commercial Bank, Canada
What to Read Next.
Canadian Existing Home Sales (Sept.) — Closed for Winter
Robert Kavcic | October 14, 2022 | Commercial Real Estate, Economic Insights
The Canadian housing market got even quieter in September, as the adjustment to higher interest rates continues to work slowly through the system. …
Continue Reading>Related Insights
Tell us three simple things to
customize your experience
Banking products are subject to approval and are provided in Canada by Bank of Montreal, a CDIC Member.
BMO Commercial Bank is a trade name used in Canada by Bank of Montreal, a CDIC member.
Please note important disclosures for content produced by BMO Capital Markets. BMO Capital Markets Regulatory | BMOCMC Fixed Income Commentary Disclosure | BMOCMC FICC Macro Strategy Commentary Disclosure | Research Disclosure Statements
BMO Capital Markets is a trade name used by BMO Financial Group for the wholesale banking businesses of Bank of Montreal, BMO Bank N.A. (member FDIC), Bank of Montreal Europe p.l.c., and Bank of Montreal (China) Co. Ltd, the institutional broker dealer business of BMO Capital Markets Corp. (Member FINRA and SIPC) and the agency broker dealer business of Clearpool Execution Services, LLC (Member FINRA and SIPC) in the U.S. , and the institutional broker dealer businesses of BMO Nesbitt Burns Inc. (Member Canadian Investment Regulatory Organization and Member Canadian Investor Protection Fund) in Canada and Asia, Bank of Montreal Europe p.l.c. (authorised and regulated by the Central Bank of Ireland) in Europe and BMO Capital Markets Limited (authorised and regulated by the Financial Conduct Authority) in the UK and Australia and carbon credit origination, sustainability advisory services and environmental solutions provided by Bank of Montreal, BMO Radicle Inc., and Carbon Farmers Australia Pty Ltd. (ACN 136 799 221 AFSL 430135) in Australia. "Nesbitt Burns" is a registered trademark of BMO Nesbitt Burns Inc, used under license. "BMO Capital Markets" is a trademark of Bank of Montreal, used under license. "BMO (M-Bar roundel symbol)" is a registered trademark of Bank of Montreal, used under license.
® Registered trademark of Bank of Montreal in the United States, Canada and elsewhere.
™ Trademark of Bank of Montreal in the United States and Canada.
The material contained in articles posted on this website is intended as a general market commentary. The opinions, estimates and projections, if any, contained in these articles are those of the authors and may differ from those of other BMO Commercial Bank employees and affiliates. BMO Commercial Bank endeavors to ensure that the contents have been compiled or derived from sources that it believes to be reliable and which it believes contain information and opinions which are accurate and complete. However, the authors and BMO Commercial Bank take no responsibility for any errors or omissions and do not guarantee their accuracy or completeness. These articles are for informational purposes only.
Bank of Montreal and its affiliates do not provide tax, legal or accounting advice. This material has been prepared for informational purposes only, and is not intended to provide, and should not be relied on for, tax, legal or accounting advice. You should consult your own tax, legal and accounting advisors before engaging in any transaction.
Third party web sites may have privacy and security policies different from BMO. Links to other web sites do not imply the endorsement or approval of such web sites. Please review the privacy and security policies of web sites reached through links from BMO web sites.
Please note important disclosures for content produced by BMO Capital Markets. BMO Capital Markets Regulatory | BMOCMC Fixed Income Commentary Disclosure | BMOCMC FICC Macro Strategy Commentary Disclosure | Research Disclosure Statements